Catalyst Inquiries with Practitioners
![]()
Catalyst @ Penn GSE convenes school and district teams to engage in a continuous improvement approach to research-practice partnerships. With Catalyst guidance and support, inquiry communities develop and test ideas to address complex challenges common across educational contexts. Through inter-district collaboration, practitioners build their capacity to utilize continuous improvement approaches in their ongoing work.
Our Approach
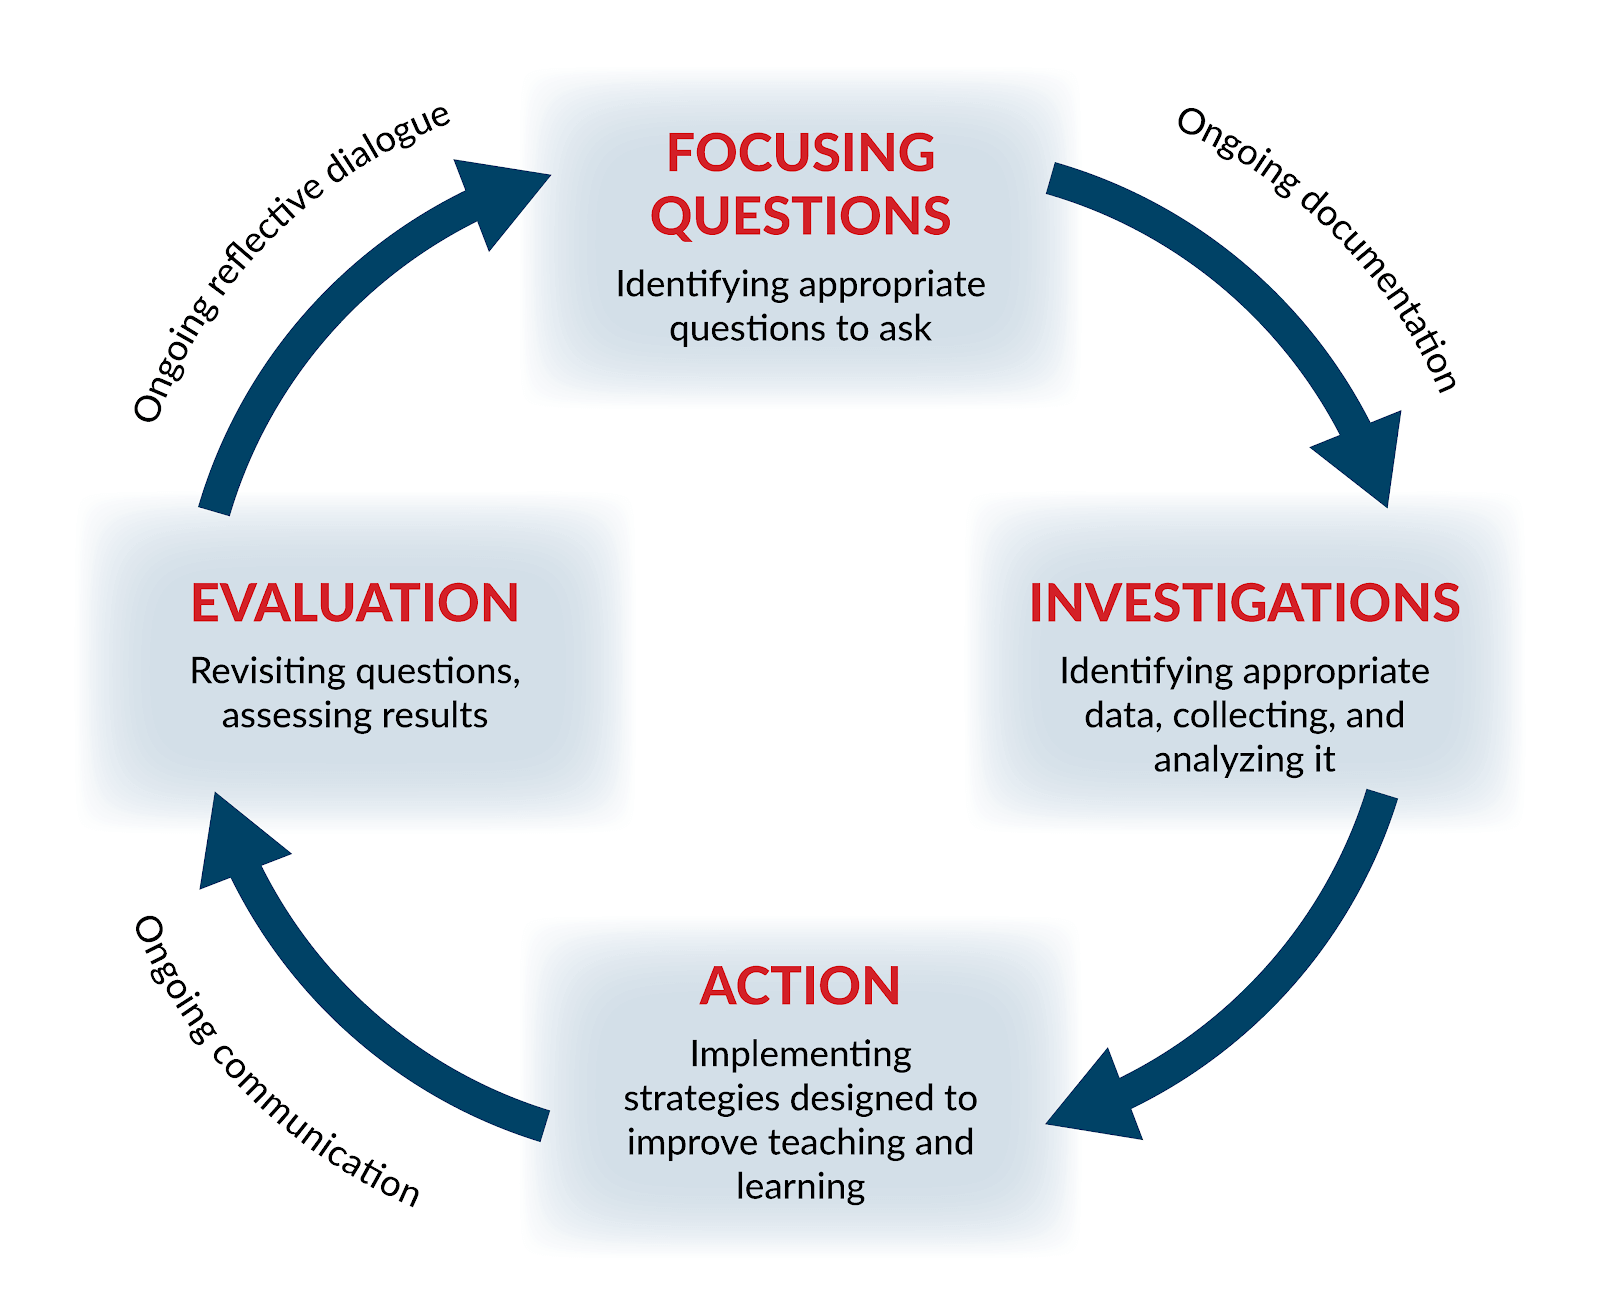
We support schools and districts in better understanding their problems of practice and designing interventions to address them using inquiry cycles that focus on:
- Robust problem definition
- Small scale, quick interventions
- Qualitative and quantitative analysis of intervention outcomes
By engaging with leaders from diverse school environments, participants can learn interventions other schools are deploying as well as possible adaptations for local contexts.
Inquiries
Learn more about our work with topical inquiry communities in the research briefs below.
Questioning in the Math Classroom
The first Catalyst @ Penn GSE Inquiry focused on the following two questions: How do teachers of mathematics in our schools use questioning? And how can we support teachers to be more aware of the types of questions they ask students?
Questioning in the Math Classroom Inquiry
This inquiry focused on Teacher Questioning in Mathematics and was chosen by Catalyst in response to a survey listing key problems of practice that was shared with Penn GSE alumni practitioners who had expressed an interest in participating. The single cycle inquiry took place over the course of six months, from January to June 2018. The inquiry consisted of four sessions.
The inquiry was guided by two focusing questions:
- How do teachers of mathematics in our schools use questioning?
- How can we support teachers to be more aware of the types of questions they ask students?
The first session (January 2018), introduced participants to an inquiry process using a four-part cycle (see the inquiry cycle figure under Our Approach) derived from Demings’ Plan-Do-Study-Act (PDSA) model, described the evidence base for effective mathematics teacher questioning, and introduced seven different frameworks for categorizing teacher questioning. Participants broke into small groups to investigate the different models and returned together to debate how the aspects of the different models could be used to develop a framework specific to their needs to assess math teachers’ use of questioning in their classrooms. Based on participants’ suggestions, the Catalyst team developed a draft classroom observation protocol, which participants were asked to pilot in a class or two and provide feedback.
The Catalyst team then refined the observation protocol and participants were asked to observe at least three teachers in their school or system (one which they considered a struggling teacher in their context, one which they considered an average teacher, and one they considered a strong math teacher). Participants collected data over the course of a month and submitted the data to Catalyst. Catalyst analyzed the results for each school and comparatively for elementary and secondary grades, looking at the question type (factual, task, procedural, conceptual, application), open/close ended questions, and teacher/student-initiated questions. Catalyst also compared the different types of questions by different teachers (struggling/average/strong).
Table 1: Question Type Framework Developed by Inquiry Group
Question Type | Description |
|---|---|
Task | Questions from the teacher to monitor progress, monitor student behavior, or questions from teachers or students to clarify classroom procedures. |
Factual | Questions that ask students to recall knowledge or that seek to solicit a name or specific information from students. Often closed ended questions. |
Procedural | Questions that ask students to identify or name a mathematical process or solve an equation that has been given. Often closed ended questions. |
Conceptual | Questions that offer students the opportunity to explain ideas, compare, contrast, identify trends, construct, generalize a process, or explain their approach. Often open ended questions. |
Application | Questions that require students to transfer knowledge or skill to a new context or evaluate, analyze or justify their own response or another’s response. Often open ended questions. |
In session two (February 2018), participants analyzed the number and percent of questions that their teachers asked within each question type for their school and for all schools combined. Participants discussed the results including trends and changes in questioning that they hoped to see in their schools. They then began to design an intervention with their teachers, to discuss the research and question type framework as well as school and teacher question type data. Each site developed an intervention based on student math questioning to increase teacher awareness and capacity to ask meaningful questions.
Table 2: Inquiry Cycle
January | Meeting 1–January 19
|
February | Create and test observation tool Meeting 2–February 21
|
March | Design and implement intervention |
April | Meeting 3–April 4
|
May | Collect post-intervention data |
June | Meeting 4–June 7
|
The third session (March 2018) was a virtual check-in to see how things were going in each site and collectively provide suggestions to participants. Participants were asked to collect data again using the same protocol with the same teachers, if possible. Again, participants collected their data and provided it to Catalyst, who added comparisons between the two data collection rounds to identify any significant changes in question types after the school’s intervention.
The fourth session (June 2018) focused on comparing pre-post results and discussing the design and influence of the experience on teacher and leader practices. The goal of the fourth session was to allow participants to share learnings with each other and to identify possible ways to continue an inquiry in question types or launch other inquiries into a problem of practice at their school sites.
Promising Practices & Lessons Learned
Through the analysis of survey, interview, and implementation data, we found that engaging leaders and teachers in an inquiry approach to evaluating their questioning can increase both open-ended questioning and high-order questions.
Finding 1: Initial changes in question types were attributed to greater teacher awareness.
Each school saw some changes in either question type or open ended questions, which was a primary goal of the intervention. Three of the five schools also saw an increase in conceptual questions.
Details
- Elementary teachers. For elementary teachers (grades K-5), while there was a small increase in total number of questions asked during the lesson, from an average of 26 to 31 questions per observation, there was a statistically significant decrease in task questions from 24% to 17%. While elementary teachers identified as either novice- and mid-performance teachers saw a significant decrease in conceptual questions, the decrease was in the context of an increase in procedural questions from 0% for teachers in the pre-intervention data collection to 37% and 19% respectively, potentially indicating a greater awareness of question types asked and attention to asking a variety of questions throughout the lesson.
- Secondary teachers. For secondary teachers (grades 6-12), there was a small overall decrease in the total number of questions asked from an average of 26 questions to 23 questions per observation, while at the same time there was a statistically significant decrease in task questions from 25% to 19% and an increase in conceptual questions from 13% to 25%. The overall increase was due to changes in question types asked by those identified as novice and mid-performance teachers which both increased from 11% conceptual questions to 26% and 24% respectively. At the secondary level, there was a statistically significant increase in the percent of open- versus close-ended questions asked by those identified as novice teachers from 27% open-ended prior to their school’s intervention to 44% post intervention. At the secondary level, teachers identified as the highest performing group did not shift their questioning type, which may indicate that the interventions had a more significant impact on novice and mid-performance teachers than those identified as most advanced.
Finding 2: School and system leaders found value in the inquiry process.
Inquiry participants reported that the process of inquiry was valuable and indicated their willingness to engage in more inquiry cycles while exploring ways to incorporate the process into other aspects of their work.
Details
- Inquiry participants took away that the process of inquiry was valuable to their own development as teachers and/or leaders and that they wanted to explore ways that inquiry could be part of their stated teacher and department professional development approach in the coming year.
- Participants indicated that further engagement in an inquiry process would be highly valuable to their school or school system development and wanted to increase the use of inquiry methods by other leaders and teachers in their school or school system through a variety of approaches including:
- Completing additional inquiry cycles focused on questioning in math to learn more each cycle with the hypothesis that this first cycle was only the beginning of increasing awareness of types of questions and that much more would be learned over time by teachers and leaders through sustained inquiry into questioning.
- A commitment to sharing learning about math questioning and the use of inquiry cycles to drive school improvement at upcoming conferences.
- Planning for the next school year that incorporated continued use of inquiry cycles as a method for driving improvement with other problems of practice.
- Of the five schools or school systems that participated in this inquiry cycle, three have chosen to participate in one or more future inquiries on different topics led by Catalyst.
Attitudes and Capacity to Use Data in Districts
The South Jersey Data Leaders Partnership (SJDLP) is an organization of more than 40 public school districts that seek to improve outcomes through the effective use of data. The goal of the partnership, which is in its third year, has been to build a culture of using data to guide decision making and, at the same time, to introduce participants to the key tenets of continuous improvement
Attitudes and Capacity to Use Data in Districts Inquiry
The South Jersey Data Leaders Partnership (SJDLP), a membership organization composed of 46 public school districts in southern New Jersey, seeks to “improve outcomes for students, teachers, schools, districts, and state departments of education through the effective use of data.” SJDLP partnered with Catalyst @ Penn GSE in the fall of 2018 to conduct an inquiry of teachers’ and administrators’ attitudes towards data and their capacity to engage in data-driven decision-making. The goal of the partnership was two-fold: to address a perceived lack of comfort among teachers in using data to inform instructional practices and to introduce participants to the key tenets of short-cycle inquiry and improvement science. The single-cycle inquiry took place over the course of nine months, from September 2018 to June 2019. The inquiry consisted of five sessions.
The first meeting of the inquiry cycle with SJDLP began with Catalyst providing an overview of the inquiry process and explaining the four key components of the inquiry cycle: the focusing question, investigation, action, and evaluation. Members then reviewed the two validated survey instruments, the Data Driven Decision Making Efficacy and Anxiety Inventory (3D-MEA) and the Dimensions of Learning Organization Questionnaire (DLOQ) used to collect data. The Catalyst team shared a brief literature review highlighting the most current research on data-use in schools in an effort to ground the inquiry in a basic understanding of data-based decision-making. SJDLP member districts, represented by teams comprising teachers, data specialists, and other building- and district-level administrators, had a six-week window to administer the survey to teachers and staff members in their schools.
At the second meeting in November, Catalyst shared preliminary South Jersey regional results as well as results for individual districts and schools. SJDLP members analyzed the data and hypothesized potential explanations and root causes for why some schools scored lower on their comfort level with analyzing and interpreting data than others. Meeting in district teams, participants discussed obvious and non-obvious explanations for the results and how to test their hypotheses. For example, one district hypothesized that differences they found between elementary and middle school teachers’ comfort level with data was due to a higher number of new teachers at the middle school, while another district hypothesized that differences in attitudes between schools was due to building-level leadership styles. Other potential root causes suggested by SJDLP members included districts’ not sharing data with teachers in a way that was both timely and comprehensive and the lack of an effective tool or platform to make the data accessible. The meeting concluded with a discussion of how to share findings with key district stakeholders by creating a data story.
At the SJDLP winter meeting, district teams focused on using the survey results to select and refine a problem statement. Several districts, for example, decided to address new teachers’ lack of confidence in using data to make decisions in the classroom. Catalyst introduced the Driver Diagram as a tool participants could use to develop a common understanding of key levers for change and a shared theory of action within each district. Participants concluded the meeting by brainstorming interventions and by considering how to test proposed theories of change quickly and easily (e.g., How will we know a change is an improvement, and what counts as data?). Participants left the meeting charged with developing and implementing a small-scale intervention and collecting data on its effectiveness before reconvening in March.
The fourth meeting, held in March, served as an opportunity for SJDLP members to share progress updates with one another and to troubleshoot challenges. Participants continued to develop an understanding of what constitutes evidence of improvement, which included a discussion about different types of data. The group also considered the differences between incremental evidence of improvement and indicators of systemic or long-term outcomes. While some districts focused on developing large-scale, long-term interventions, which they planned to implement over the spring and during the following school year, others focused on smaller, more targeted strategies, like introducing a small group of teachers at one school to a new protocol to use when reviewing data.
At the fifth and final meeting in May, each district team brought a one-page summary of the inquiry work they had accomplished during the school year as well as expected plans for 2019-20. In addition to sharing the summaries and receiving feedback, participants discussed the role of evaluation in the inquiry cycle process. The meeting concluded with a whole-group reflection on what individuals had learned from participating in the inquiry cycle this past year.
Promising Practices & Lessons Learned
Through the analysis of survey and interview data as well as observations during inquiry meetings, we found that inquiry teams often focus improvement efforts on interventions related to systems and structures for using data in their schools. In the first year of the inquiry, many teams did not as clearly articulate how the systems would be piloted, what implementation would entail, and how these new systems or routines would be evaluated. This observation has informed our learning at Catalyst about how we can better structure our inquiry process and facilitation to help improvement teams more fully use these important practices in continuous improvement.
Finding 1: Inquiry teams often focus improvement efforts on interventions related to systems and structures for using data in their schools.
All inquiry teams (school or district) identified systems, structures, and processes that needed to be created or implemented in order to improve data use in their systems. These systems or processes spanned technical systems to structures in school and district schedules.
Details
- Technical solutions. Approximately a third of participating teams identified that their schools or districts needed to implement a new technology in order to support data use. These technologies included tools focused on qualitative data collection for staff surveys, quantitative data collection tools or assessment management systems for student assessment data, and data analysis and visualization tools. One improvement team framed this as an aim to make charts, graphs, and other forms of data “less intimidating for teachers.” This focus on technical solutions may be due in part to the membership of the SJDLP where at least some members hold assessment and data management administrative responsibilities. This finding may also represent a true gap in the abilities of schools and districts to generate and access data that, if not addressed, would prevent deeper work with teachers and leaders around data use.
- Structures and processes to enable data use. All improvement teams discussed creating processes within their schools and districts to support data use. These included creating teams specifically designed to look at data, developing specific meeting structures between school and district leaders, or data-focused meetings at schools and across schools. Other teams focused on providing training for using data and/or creating protocols for data analysis. One improvement team described their approach as providing “targeted training on data drive problem solving.” Interestingly, for some improvement teams, the protocols and training would be introduced in existing meeting structures such as Professional Learning Communities or district-wide quarterly meetings while other schools and districts chose to design both the protocol or training and the space in which it would take place.
Finding 2: Inquiry teams need increased support to use continuous improvement approaches.
While each inquiry meeting focused on a different aspect of continuous improvement, including the value of short inquiry cycles, most inquiry teams immediately identified potential solutions and approached implementing those solutions in ways that are typical of large-scale improvement approaches. Rather than identifying ideas to test or pilot in low impact areas, most improvement teams planned to implement their ideas system-wide and for the entire school year. This led the improvement facilitation team at Catalyst to reflect on times when improvement teams employed continuous improvement practice and ways in which Catalyst could adapt facilitation of inquiry communities to foster the sort of small-scale and very initial experimentation necessary to engage in true continuous improvement.
Details
- Testing ideas. Fewer than a third of improvement teams discussed piloting or trialing their new systems or structures. When improvement teams did plan to test their ideas, they primarily took two approaches: (1) testing with a single grade level team or teams or (2) expanding an approach for which they had prior evidence of success in one school or grade level to other schools or grade levels.
- Focusing on implementation. Most improvement teams discussed larger scale systems and structures as implementation supports in and of themselves, for example pairing training or professional development with a new data technology system. Rarey did improvement teams identify the specific ways in which a new structure or routine would be implemented as part of their overall improvement strategy and thus failed to identify how they would collect implementation data in addition to the survey data.
New Approaches
- Leveraging inquiry community meetings to plan short-cycle tests of change. In the second and third years of this inquiry community, Catalyst has begun using Plan, Do, Study, Act (PDSA) cycles as the short-cycle inquiry model. In the 2020-21 school year, Catalyst is supporting improvement teams with planning and testing change ideas on a smaller scale through pilots in addition to or instead of implementing sweeping changes.
- Gathering evidence before scaling. Through leveraging consistent PDSA cycles, Catalyst facilitators will focus support efforts on providing improvement teams with consulting and feedback specifically focused on gathering evidence related to implementation and using that evidence to inform their next inquiry cycle such that PDSA cycles are connected and evidence is gathered before change ideas are implemented more widely.
Equity and Student Belonging
The Equity and Student Belonging Inquiry Community began in fall 2018 and is now in its third year. In this inquiry community, district teams in Southeastern Pennsylvania are investigating the sense of belonging among their student populations and learning how to use improvement science to support their work.
Equity and Student Belonging Inquiry
In the fall of 2018, after surveying a host of K-12 practitioners to determine their highest priority problems of practice, Catalyst @ Penn GSE facilitated a short-cycle inquiry on student sense of belonging. The purpose of this offering was twofold: to help educators address this important problem of practice and to introduce them to an effective methodology for addressing a wide range of school-based challenges. This inquiry followed a partial cycle, taking place over the course of four months from September through December 2018 rather than over the course of a full academic year. The inquiry consisted of two sessions, with two optional sessions added in Spring 2019 to support districts with developing plans to respond to what they learned in the fall sessions.
To begin the inquiry process, participating district teams, comprising teachers, counselors, and administrators attended an introductory meeting with Catalyst @ Penn GSE. Responding to an open invitation, 15 public school districts and two independent schools joined the inquiry group, with 13 teams attending in person at Penn and four joining virtually. At the first meeting, Catalyst, along with experts in student social development, reviewed the current research on student sense of belonging with participants. Catalyst then introduced the Psychological Sense of School Membership Survey (the PSSM), a validated survey instrument intended to help districts develop a deeper understanding of how students in their school communities view issues related to belonging. With Catalyst’s support, district teams customized the survey to meet the needs of their unique contexts and also decided which grade levels to survey. Districts then had a six-week window to administer the survey to students via an online link, after which Catalyst staff analyzed the results.
At the second meeting in December, each team received a customized report of survey findings, which included results for each grade level and school that participated, district-wide results, and the combined results of the 15 districts and two independent schools in the inquiry. Meeting in individual district teams as well as in cross-district support groups, participants analyzed their data for trends, unexpected outcomes, and potential root causes that might explain their results. Equipped with this information, participants returned to their respective districts and shared survey results with key stakeholders, including school board members, administrators, teachers, and parents. Based on what they learned from their survey results and stakeholder engagement, district teams developed interventions designed to increase student sense of belonging in school.
Catalyst hosted two optional virtual meetings in the spring of 2019 to provide interested participants with additional support. During these one-hour online meetings, participants gave progress updates on the work they were doing and brainstormed potential solutions to implementation challenges.
Promising Practices & Lessons Learned
Analysis of surveys, interviews, and participant reflections yielded several interesting insights about how schools approached improving students’ sense of belonging, and how practitioner-led inquiry around continuous improvement could support developing and implementing these interventions.
Finding 1: Participants ultimately embraced a variety of interventions ranging from targeted student supports, to whole-school initiatives, to engagement of families to increase student belonging, rather than converging on a single approach.
- Examples of individual student supports that district teams developed included:
- A mentoring program that paired 30 students at risk for not developing a sense of belonging with different staff members in order to provide these children with extra social and emotional support.
- An exercise asking teachers which students from the entire student body they could identify by name and whether they knew something personal about them. Staff at the school then took responsibility for developing a relationship with each of the students whom no one could identify beyond a first and last name.
- Examples of whole-school initiatives developed by districts included:
- Developing a digital handbook for ninth graders transitioning to high school and for fifth graders transitioning to middle school.
- Pairing transitioning grades (g. eighth grade to ninth grade) for school tours and relationship building to support transitions between schools.
- Starting several new after-school clubs targeting the interests of students who were not already involved in extracurriculars, and providing a late bus to help remove barriers to participation related to transportation.
- One district prioritized family engagement by hosting a cultural awareness activity at the end of the school year during which each student brought a family member to school and shared the story of why it was meaningful with their peers.
Finding 2: Supporting districts with adopting an inquiry cycle approach required flexibility, customization, and collaboration to address districts’ varying needs and adapt to their unique contexts.
- Schools and districts that already had initiatives in place to address issues related to school climate and student sense of belonging made the most progress during the 2018-19 school year and found the inquiry cycle to be a helpful approach to evaluating, refining, and expanding their existing initiatives. Those without these initiatives needed more time to both develop their intervention and learn about the inquiry cycle approach.
- All participants, however, regardless of their prior work or experience related to belonging, valued Catalyst’s role in administering the survey instrument and analyzing the results. Given demands on educators’ time and resources, participating districts reported they had neither the time nor the expertise to administer and analyze a large-scale survey without technical support.
- District teams also valued the flexibility of the inquiry cycle and the ability to adapt the process to their own particular context. Because districts decided which issues to address within the broader construct of student sense of belonging and then designed, implemented, and evaluated their own interventions, participants developed a strong sense of ownership for their work.
- One participant noted, “I think that the entire process was beneficial because I felt like it wasn't something that was just disseminated down, I felt like it was a partnership.”
- Participants also expressed appreciation for the opportunity to collaborate with educators from other schools and districts. Realizing that other schools and districts faced similar issues and challenges regarding school climate allowed participants to engage in open and honest dialogue about sensitive topics and learn from the work other districts were doing.
Work with us
To learn more about joining one of our inquiry communities, please contact Megan MacDonald at mmacdo@gse.upenn.edu.