“Penn is a place where what I read, do, write, and learn has a bigger purpose: to be put into work.”
Birdiana Rodriguez, M.S.Ed. '18
Our Values
At Penn GSE, your academic development will be framed by themes that permeate your graduate experience. The Office of Student Services offers every student guidance and support in navigating your educational journey.
Visit the Office of Student Services
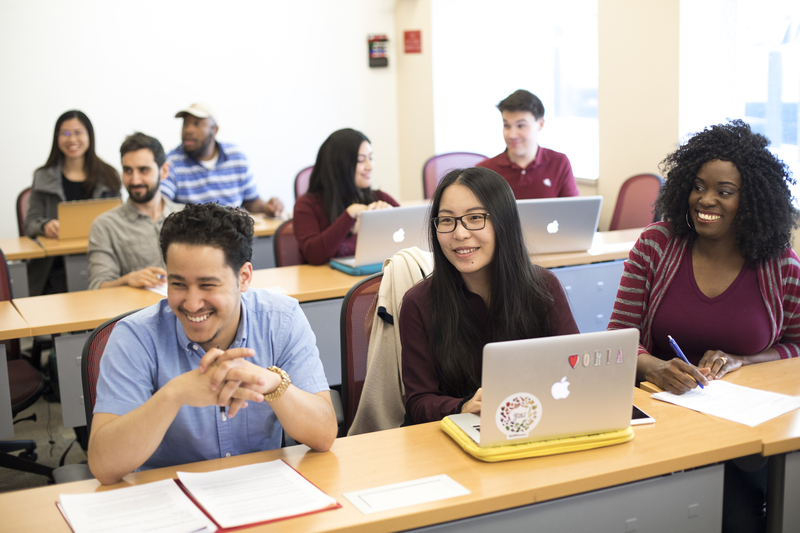
An Inclusive Community
As a community of scholars and practitioners, we unite through different organizations to enact our shared values and responsibilities. We value the uniqueness of people and perspectives, and we celebrate people’s differences, talents, and abilities through international gatherings and cultural celebrations. Ultimately, we are bound together by our community-wide events.
Well-being
We acknowledge that physical and emotional health are important and affect our ability to engage productively in our work. In addition to several fitness centers on campus, Penn also provides mental health services and campus health programs such as massage therapy, weekly meditations, and healthy food initiatives for a holistic approach to wellness.
- Pottruck Health and Fitness Center
- Counseling & Psychological Services at Penn
- Sexual Trauma Treatment Outreach and Prevention
Leadership
At the Graduate Student Center and through GSE Student Government, we invest in and contribute to the future of the university and the profession. We strive for professional excellence by establishing and using our best efforts to achieve high expectations.
Integrity
We define integrity as acting according to the values, beliefs and principles we hold; it is how we respond if we are faced with a moral dilemma when no one is watching. It is also being aware of actions that constitute violations of the Student Codes of Conduct and understanding the role of the Office of Student Conduct on campus. With the help of our Academic Integrity Guide, we commit to maintaining strong morals by understanding how to collaborate on research and acknowledge our sources responsibly.
Academic Experiences
Learning is not limited to classrooms and libraries. Penn GSE students have the opportunity to apply their skills and knowledge throughout the School, the region, and the world.
Go Learn through applied knowledge and experiences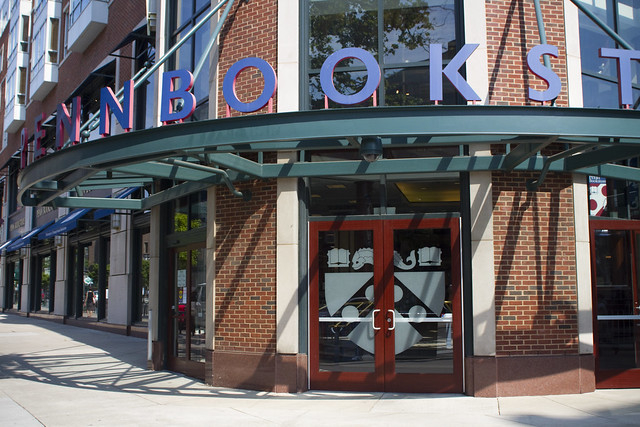
University Resources
Discover the resources and benefits of the University of Pennsylvania.
Go Discover support resources for students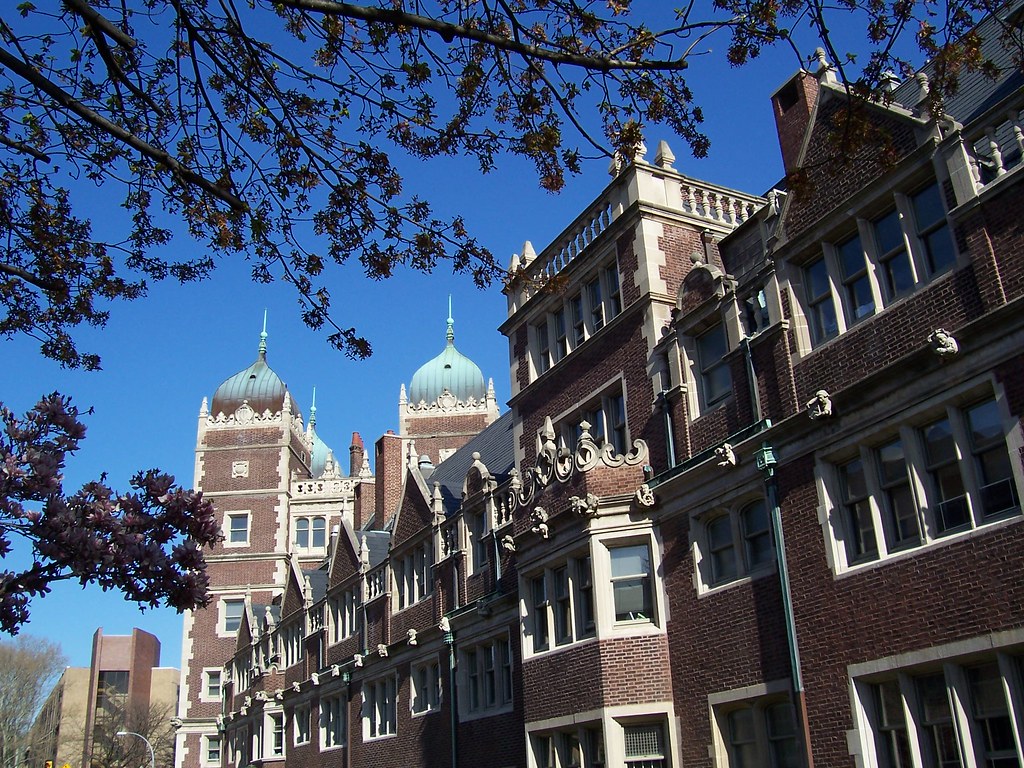
Campus Housing
University of Pennsylvania is located in the neighborhood of West Philadelphia. Discover on-campus and off-campus housing located within walking and biking distance of the campus.
Go to Penn housing for graduate students